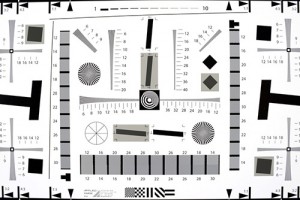
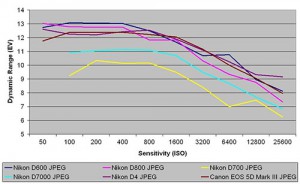
Techradar has posted D600 signal to noise ratio and dynamic range test results using DXO Analyzer. The test compared the Nikon D600 as well as the D4, D800, D700, D7000 and Canon 5D Mark III. The results show dynamic range is outstanding and very close to the D800 (which earned the highest ever rating in DxO’s official lab test). Singal to noise ratio is higher than the D700 and D800, and its margin increases as ISO increases, however the D4 takes has the advantage throughout, espeically at the high end of the ISO range. Techradar also has image quality resolution charts and high ISO sample images from the D600.
 Imaging Resource produced their standard set of lab shots using the Nikon D600. You can compare it head-to-head with over 100 other cameras, including D700, D800, D7000 and Canon 1D X, 5D Mark II and 5D Mark III on their web site.
The D600 is still on the Camera & Photo Best Sellers on Amazon. You can see its position relative to the other Digital Cameras on Amazon.
Additional retailers are offering the D600. OneCall and J&R now have the Nikon D600 available for pre-order. With an in-demand camera like the D600, the usual retailers get all the orders and their waiting lists grow longer by the day. If you haven’t pre-ordered yet, your best bet may be one these alternatices. The first retailers to offering the D600 within an hour of its official announcement were Amazon and B&H Photo. Later Adorama, Samy’s Camera and Best Buy opened their pre-orders. Retailers will begin shipping on September 18-19 to those who have pre-ordered.


Signal to noise comparisons shooting jpegs are useless. You may be measuring some quality image, but mostly just their jpeg processing.
Techradar performed separate tests using JPEG and TIFF (converted from raw). You can follow the link above to see the complete results. I believe the last chart on their page (and the one appearing with this article) showing dynamic range JPEG is mislabeled and should be TIFF because they have another chart showing JPEG results that are different.